
IOT-传感值的数据分析
2019-12-309907

AI 快速预览详细
本文介绍了如何使用NodeMCU和振动传感器进行IOT数据采集,并通过MATLAB在ThingSpeak平台上进行数据分析。首先展示了硬件部分,包括NodeMCU和振动传感器的连接方式。接着提供了详细的IOT代码示例,用于将传感器数据上传到ThingSpeak。最后,通过MATLAB分析工具对数据进行可视化和分析。适合对IOT数据处理感兴趣的用户。
|
传感数值的分析预测通常是python来做的。 这次探索用不那么复杂的matlab来做,matlab因其强大的数学运算功能而为各种研究机构使用,学起来也不容易,好在thingspeak和matlab进行了合作,使得问题相对简化 还是用上篇的震动传感IOT。 先看硬件部分 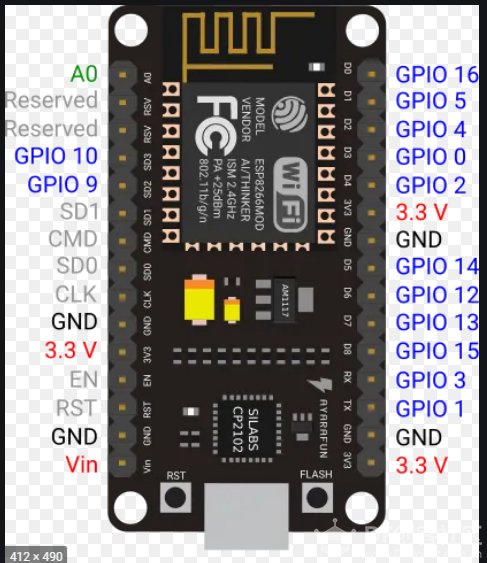 NodeMCU 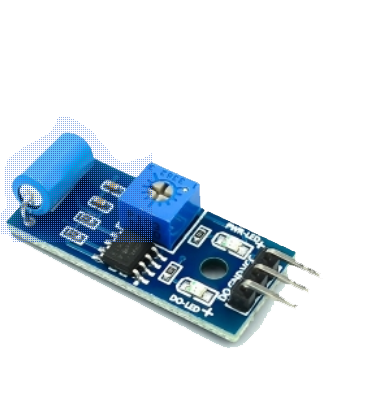 振动传感 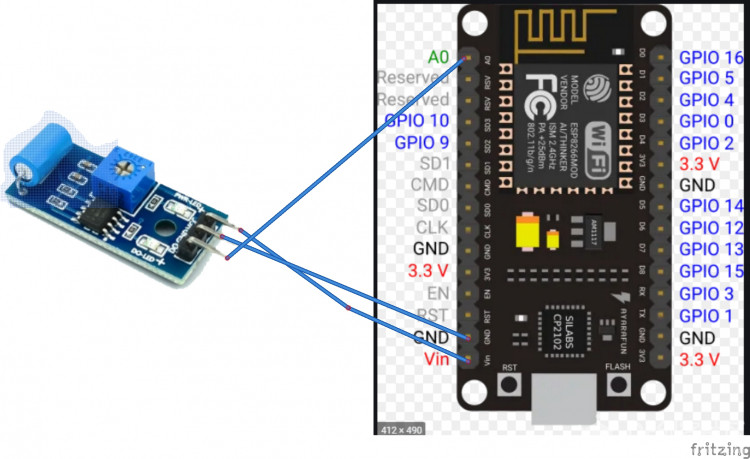 连线图 [mw_shl_code=applescript,true]#include <ESP8266WiFi.h> String apiKey = ""; const char *ssid = ""; const char *pass = ""; const char* server = "api.thingspeak.com"; WiFiClient client; //--------------------SETUP--------------- void setup(){ Serial.begin(115200); delay(10); Serial.println("Connecting to "); Serial.println(ssid); WiFi.begin(ssid, pass); while (WiFi.status() != WL_CONNECTED) { delay(500); Serial.print("."); } Serial.println(""); Serial.println("WiFi connected"); } //--------------LOOP----------------- void loop(){ float h = analogRead(A0); if (client.connect(server, 80)) { String postStr = apiKey; postStr += "&field1="; postStr += String(h/1023*100); postStr += "r\n"; client.print("POST /update HTTP/1.1\n"); client.print("Host: api.thingspeak.com\n"); client.print("Connection: close\n"); client.print("X-THINGSPEAKAPIKEY: " + apiKey + "\n"); client.print("Content-Type: application/x-www-form-urlencoded\n"); client.print("Content-Length: "); client.print(postStr.length()); client.print("\n\n"); client.print(postStr); Serial.print("Noise Level: "); Serial.println(h/1023*100); Serial.println("Data Send to Thingspeak"); } client.stop(); Serial.println("Waiting..."); // thingspeak needs minimum 15 sec delay between updates. delay(1500); } [/mw_shl_code] IOT 代码 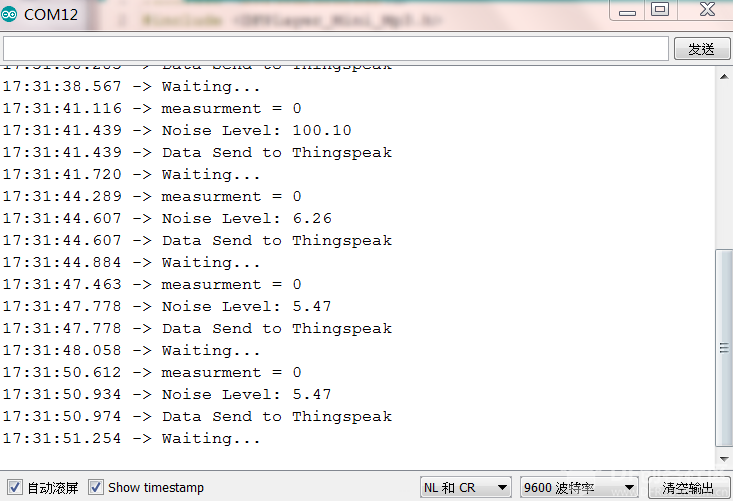 串口数据 ------------------ 然后是thingspeak部分 先登录thingspeak.com 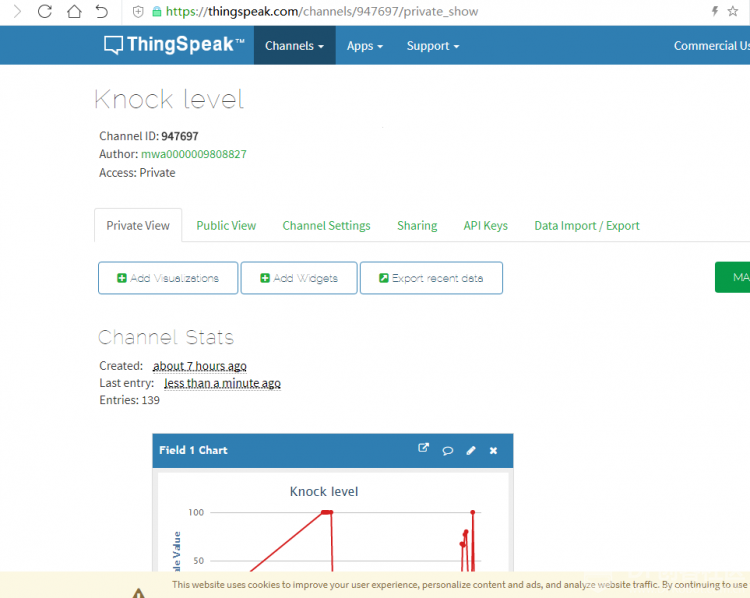 看到图表 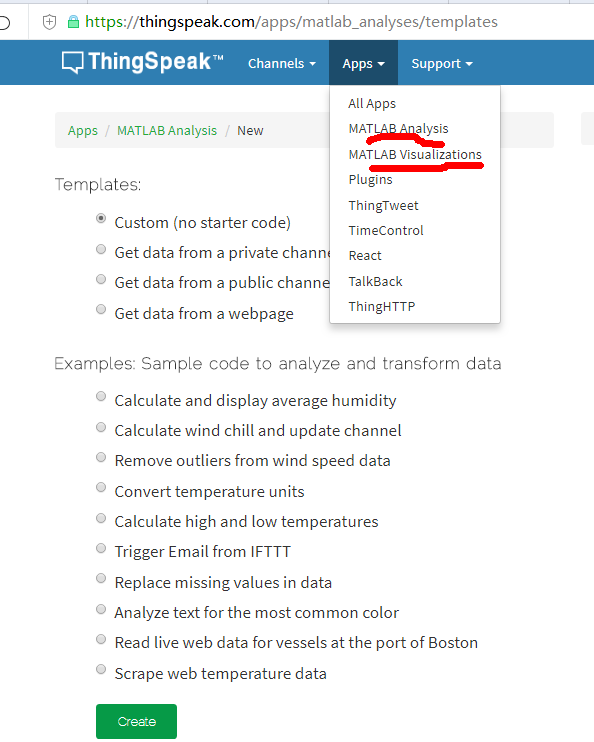 这里的两项,matlab analysis是数据分析,MATLAB visual是matlab高级图表展示 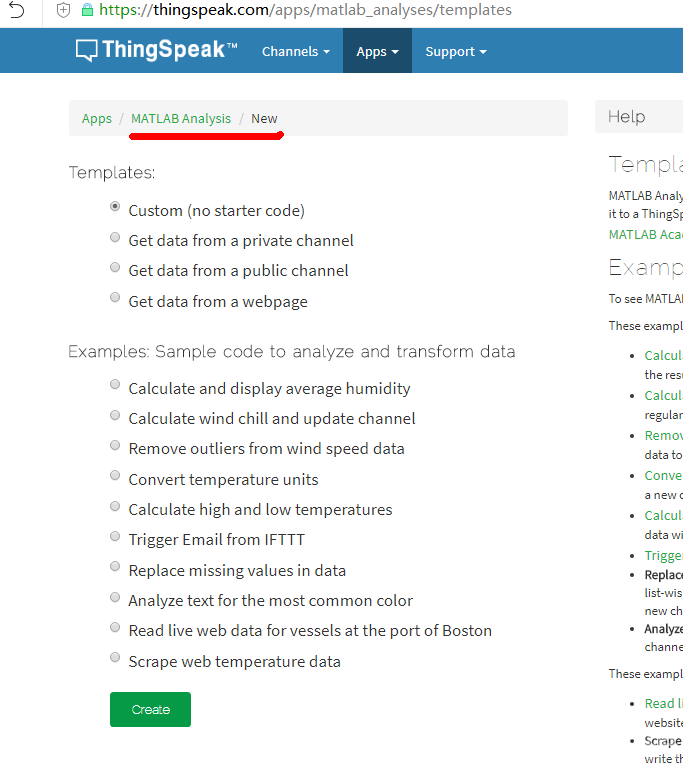 上面有一些样例,方面参照。 同时也提供空白代码编辑区,只有你对matlab代码有了解,就可以自己撸码。在我看来m文件和c文件差不多。 [mw_shl_code=applescript,true]% Read raw data for the past day from a ThingSpeak channel and % visualize hourly number of vibs using the AREA function. % Channel ID to read data from readChannelID = 947697; % Channel Read API Key % If your channel is private, then enter the read API % Key between the '' below: readAPIKey = '2M1072OYWK9189UU'; % Read vib data for the last 33 hours in a timetable, including % timestamps for each measurement [data, timeStamps ] = thingSpeakRead(readChannelID, 'Fields', [1], 'NumMinutes', 60,... 'ReadKey', readAPIKey, 'Outputformat', 'Timetable'); % Plot the averaged data as an area plot. xlabel('Time'); ylabel('Average Number'); [/mw_shl_code] 简单写一段,应该可以看到坐标了。如果需要对比分析,需要两项测量指标。会用到数学公式。当然,这里只能温习了一些数学。 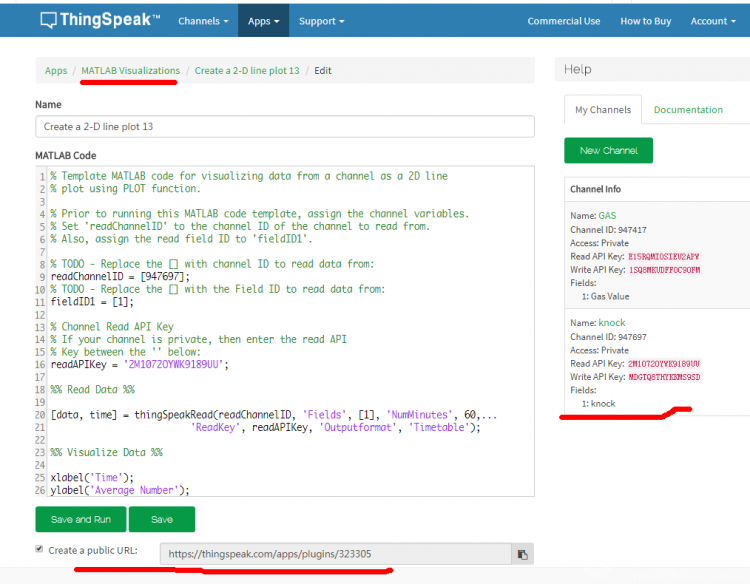 下方有一行,是提供了matlab表也的url。这样方便第三方工具进行调用 例如用MIT app inventor可以很快写个app,用手机去打开matlab表页 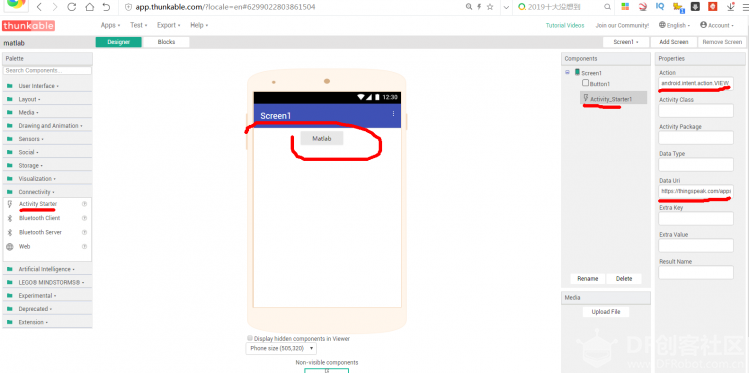 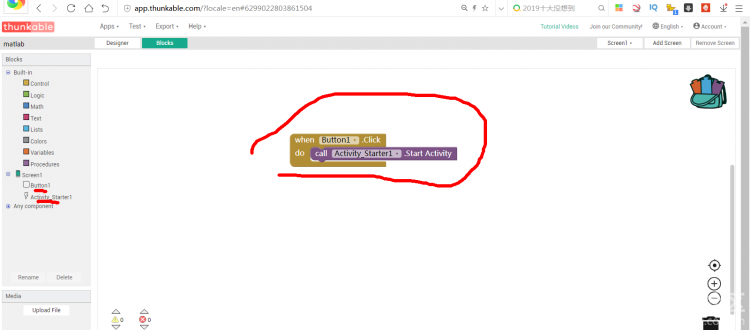 |