行空板介绍以及Mind+使用
https://makelog.dfrobot.com.cn/article-311576.html
大家可以先看看这篇帖子,大致了解什么是行空板,以及使用行空板的主要软件。然后再具体学习以下内容。
功能介绍
此项目主要功能为实时显示数据和图表绘制。
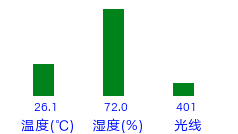
显示柱状图
实时显示温湿度、光线,柱状图形式呈现到行空板屏幕上。
部分代码如下:
import time
from unihiker import GUI   #导入包
from pinpong.board import Board,Pin,DHT11
from pinpong.extension.unihiker import *
gui=GUI()  #实例化GUI类

Board().begin()               #初始化

dht11 = DHT11(Pin(Pin.P21))

def numberMap(x, in_min, in_max, out_min, out_max):
  return (x - in_min) * (out_max - out_min) / (in_max - in_min) + out_min

temp_text = gui.draw_text(x=50, y=320, text='温度(℃)',color ='blue',origin='bottom',font_size=10)
temp_value = gui.draw_text(x=48, y=300, text='',color ='blue',origin='bottom',font_size=8)
temp1=gui.fill_rect(x=35, y=280, w=20, h=20,  color="green")

humi_text = gui.draw_text(x=120, y=320, text='湿度(%)',color ='blue',origin='bottom',font_size=10)
humi_value = gui.draw_text(x=118, y=300, text='',color ='blue',origin='bottom',font_size=8)
humi1=gui.fill_rect(x=105, y=280, w=20, h=20,  color="green")

light_text = gui.draw_text(x=190, y=320, text='光线',color ='blue',origin='bottom',font_size=10)
light1_value = gui.draw_text(x=188, y=300, text='',color ='blue',origin='bottom',font_size=8)
light1=gui.fill_rect(x=175, y=280, w=20, h=20,  color="green")

def temp_color(value):
    if value > 30:
        temp1.config(color='red')
    else:
        temp1.config(color='green')
def humi_color(value):
    if value > 85:
        humi1.config(color='red')
    else:
        humi1.config(color='green')
def light_color(value):
    if value > 2500:
        light1.config(color='red')
    else:
        light1.config(color='green')
while True:
        temp = dht11.temp_c() #读取摄氏温度
       # tempvalue.append(temp)

        humi = dht11.humidity() #读取湿度

        # print("dht11 temperature=",temp," humidity=",humi)
        temp_value.config(text=round(temp,1))
        temp1.config(h=-numberMap(round(temp,1),0,100,0,120))
        temp_color(temp)

        humi_value.config(text=humi)
        humi1.config(h=-numberMap(humi,0,100,0,120))
        humi_color(humi)

        light_value = light.read()

        light1_value.config(text=light_value)

        light1.config(h=-numberMap(light_value,0,4095,0,120))
        light_color(light_value)
        #print("光线强度:%d"%(light_value)) #终端打印信息
效果展示

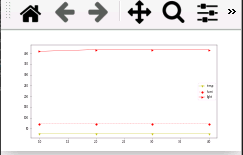
折线图显示
主要根据列表数据,把温湿度、光线数据实时绘制到图表上。
部分代码:
import time
from unihiker import GUI   #导入包
from pinpong.board import Board,Pin,DHT11
from pinpong.extension.unihiker import *
import matplotlib.pyplot as plt

gui=GUI()  #实例化GUI类
Board().begin()               #初始化
dht11 = DHT11(Pin(Pin.P21))

tempvalue=[]
humivalue=[]
lightvalue=[]
xdata=[]
Flag=0
fig = plt.figure(figsize=(16, 6),dpi=20)#设置绘制窗口

while True:
        temp = dht11.temp_c() #读取摄氏温度
        humi = dht11.humidity() #读取湿度
        light_value = light.read()
        Flag += 1
        if len(tempvalue)>20 :
            Flag = 0
            tempvalue=[]
            humivalue=[]
            lightvalue=[]
            xdata=[]
        xdata.append(Flag)
        tempvalue.append(round(temp,1))
        humivalue.append(humi)
        lightvalue.append(light_value)

        plt.clf()
        plt.plot(xdata, tempvalue, 'yv-', alpha=1, linewidth=1)
        plt.plot(xdata, humivalue, 'ro:', alpha=1, linewidth=1)
        plt.plot(xdata, lightvalue, 'r>-', alpha=1, linewidth=1)
        plt.legend(['temp','humi','light'])
        plt.pause(0.1)  #显示秒数
        plt.ioff()
效果展示:
效果展示
电脑远程桌面
1、利用电脑自带的远程桌面连接行空板,操作如下:
2、输出行空板地址,默认地址:10.1.2.3
3、连接成功显示,行空板主页面
效果展示:
总结
目前只是做了最基础的效果,后续要丰富功能,例如:语音播报、触摸切换等。还要对外观进行美观,加个外壳看起来美观。大家对这个功能页面有什么更好的建议提出来,进行改进。