|
12720| 4
|
[入门] 【在 Arduino 上使用机器学习】(二)Tensorflow上构建及训练... |

|
【在 Arduino 上使用机器学习】(一)在 Arduino 开发板上安装库及添加测试样本 【在 Arduino 上使用机器学习】(二)Tensorflow上构建及训练模型 【在 Arduino 上使用机器学习】(三)在Arduino上使用自定义手势识别模型 在 TensorFlow 中训练 我们将通过 Google Colab,使用我们在上一部分从 Arduino 开发板收集的数据训练我们的机器学习模型。Colab 提供 Jupyter 笔记本,可让我们在网络浏览器中运行自己的 TensorFlow 训练。 在 Colab 中打开笔记本:https://colab.research.google.co ... nyml_workshop.ipynb 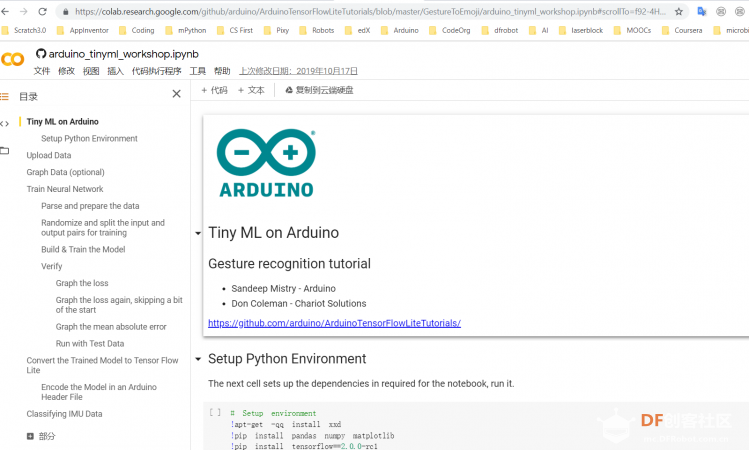 运行时会弹出警告,点击“仍然运行” 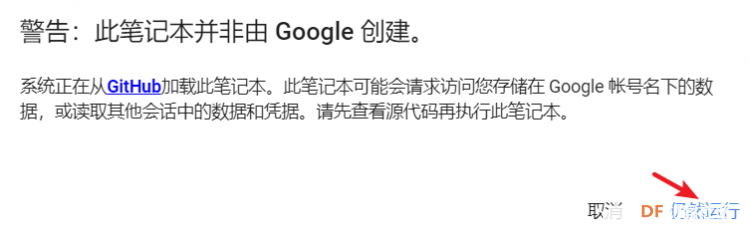 在 Colab中按照Jupyter笔记本文件逐步完成以下步骤:
1. 设置Python环境 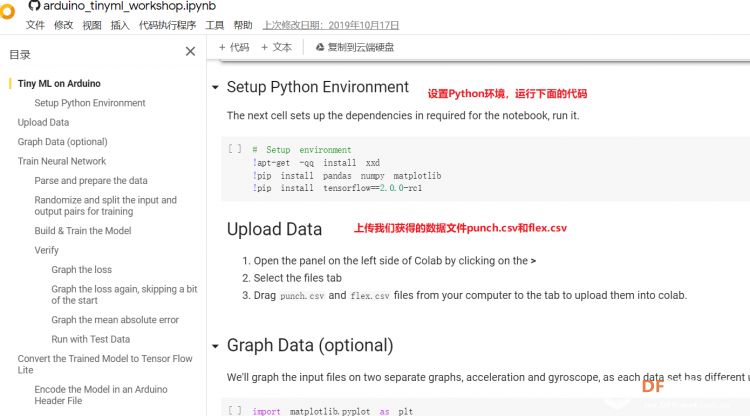 成功设置环境: 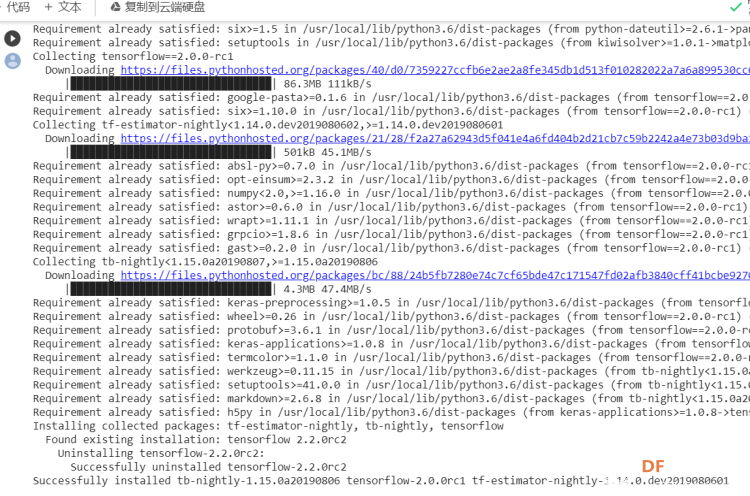 2. 上传CSV文件 我们需要将上一节获取的样本文件punch.csv和flex.csv上传workshop中对模型进行训练 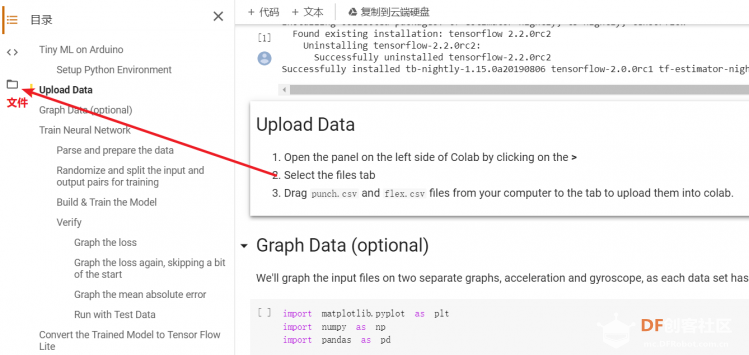 点击”上传“,选择文件后上传 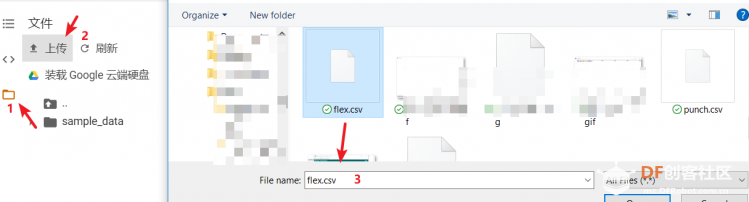 上传成功: 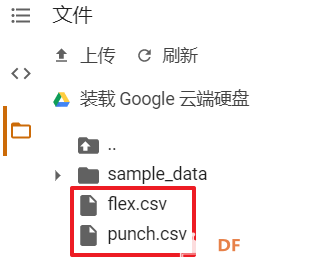 3. 图形化数据(可选) [mw_shl_code=python,false]import matplotlib.pyplot as plt import numpy as np import pandas as pd filename = "punch.csv" df = pd.read_csv("/content/" + filename) index = range(1, len(df['aX']) + 1) plt.rcParams["figure.figsize"] = (20,10) plt.plot(index, df['aX'], 'g.', label='x', linestyle='solid', marker=',') plt.plot(index, df['aY'], 'b.', label='y', linestyle='solid', marker=',') plt.plot(index, df['aZ'], 'r.', label='z', linestyle='solid', marker=',') plt.title("Acceleration") plt.xlabel("Sample #") plt.ylabel("Acceleration (G)") plt.legend() plt.show() plt.plot(index, df['gX'], 'g.', label='x', linestyle='solid', marker=',') plt.plot(index, df['gY'], 'b.', label='y', linestyle='solid', marker=',') plt.plot(index, df['gZ'], 'r.', label='z', linestyle='solid', marker=',') plt.title("Gyroscope") plt.xlabel("Sample #") plt.ylabel("Gyroscope (deg/sec)") plt.legend() plt.show() [/mw_shl_code] 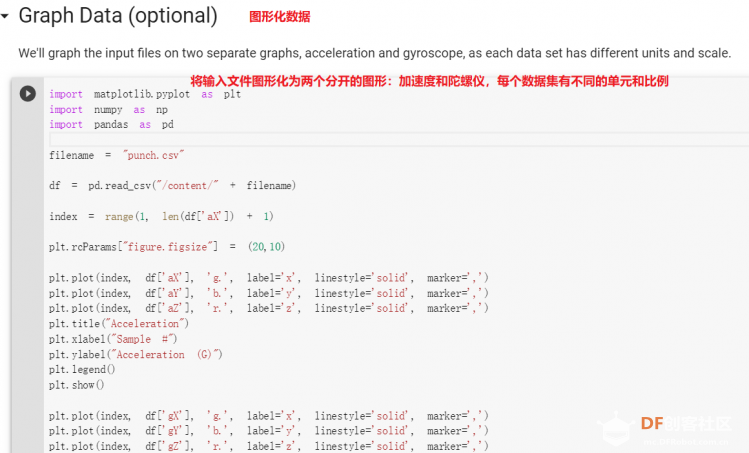 第一次图形化结果不正常,导入的数据有问题。 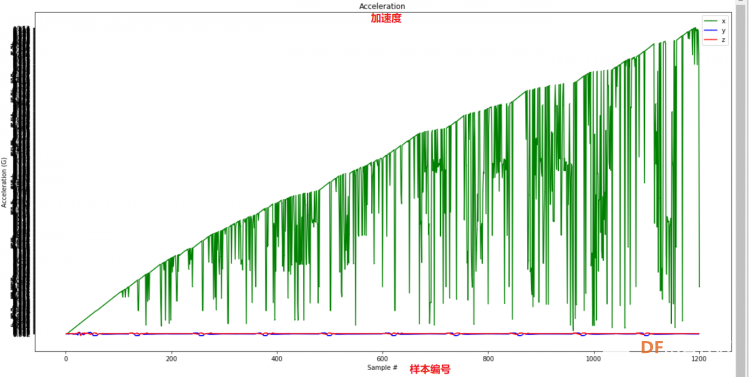 修正错误后重新图形化数据: 加速度: 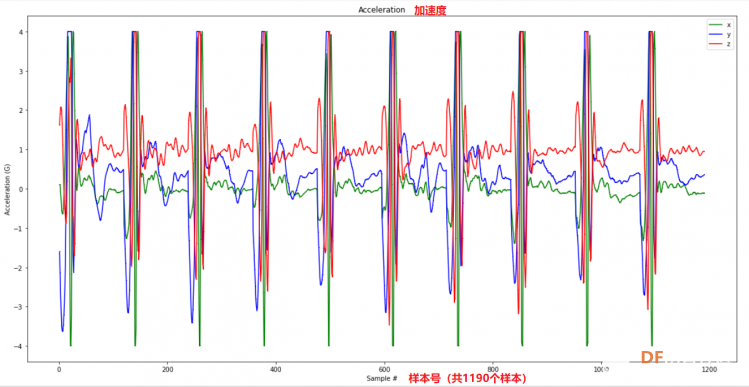 陀螺仪: 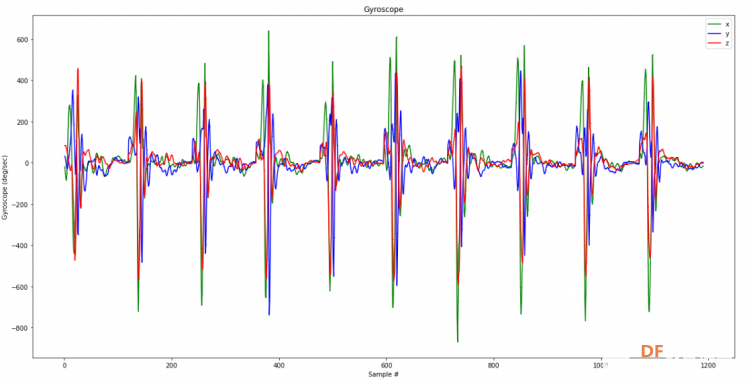 4. 训练神经网络 1) 解析和准备数据 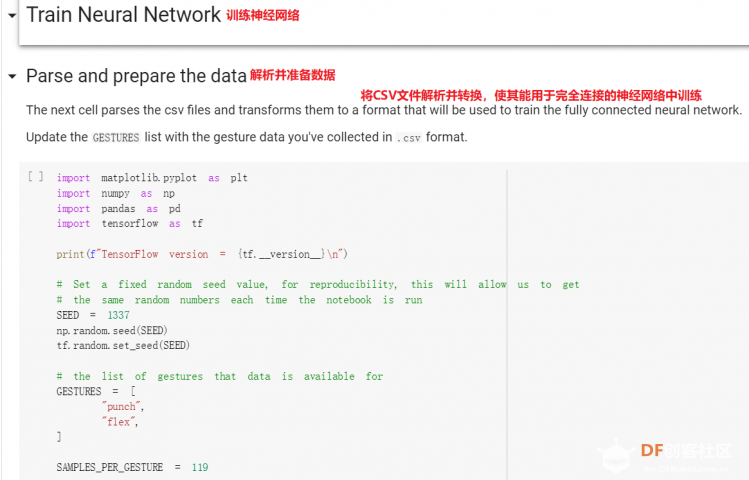 解析程序如下:[mw_shl_code=python,false]import matplotlib.pyplot as plt import numpy as np import pandas as pd import tensorflow as tf print(f"TensorFlow version = {tf.__version__}\n") # Set a fixed random seed value, for reproducibility, this will allow us to get # the same random numbers each time the notebook is run SEED = 1337 np.random.seed(SEED) tf.random.set_seed(SEED) # the list of gestures that data is available for GESTURES = [ "punch", "flex", ] SAMPLES_PER_GESTURE = 119 NUM_GESTURES = len(GESTURES) # create a one-hot encoded matrix that is used in the output ONE_HOT_ENCODED_GESTURES = np.eye(NUM_GESTURES) inputs = [] outputs = [] # read each csv file and push an input and output for gesture_index in range(NUM_GESTURES): gesture = GESTURES[gesture_index] print(f"Processing index {gesture_index} for gesture '{gesture}'.") output = ONE_HOT_ENCODED_GESTURES[gesture_index] df = pd.read_csv("/content/" + gesture + ".csv") # calculate the number of gesture recordings in the file num_recordings = int(df.shape[0] / SAMPLES_PER_GESTURE) print(f"\tThere are {num_recordings} recordings of the {gesture} gesture.") for i in range(num_recordings): tensor = [] for j in range(SAMPLES_PER_GESTURE): index = i * SAMPLES_PER_GESTURE + j # normalize the input data, between 0 to 1: # - acceleration is between: -4 to +4 # - gyroscope is between: -2000 to +2000 # print(df) tensor += [ (df['aX'][index] + 4) / 8, (df['aY'][index] + 4) / 8, (df['aZ'][index] + 4) / 8, (df['gX'][index] + 2000) / 4000, (df['gY'][index] + 2000) / 4000, (df['gZ'][index] + 2000) / 4000 ] inputs.append(tensor) outputs.append(output) # convert the list to numpy array inputs = np.array(inputs) outputs = np.array(outputs) print("Data set parsing and preparation complete.")[/mw_shl_code] 解析出现错误: 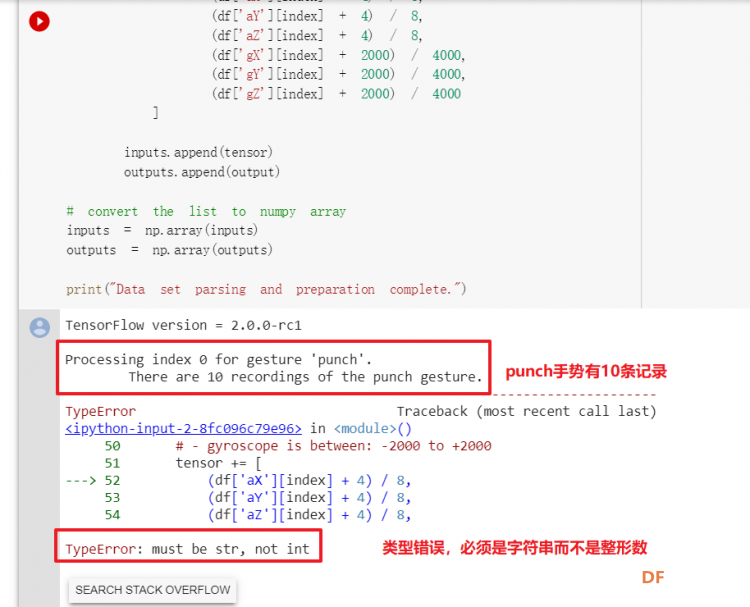 通过调试程序发现,多出来一行数据: 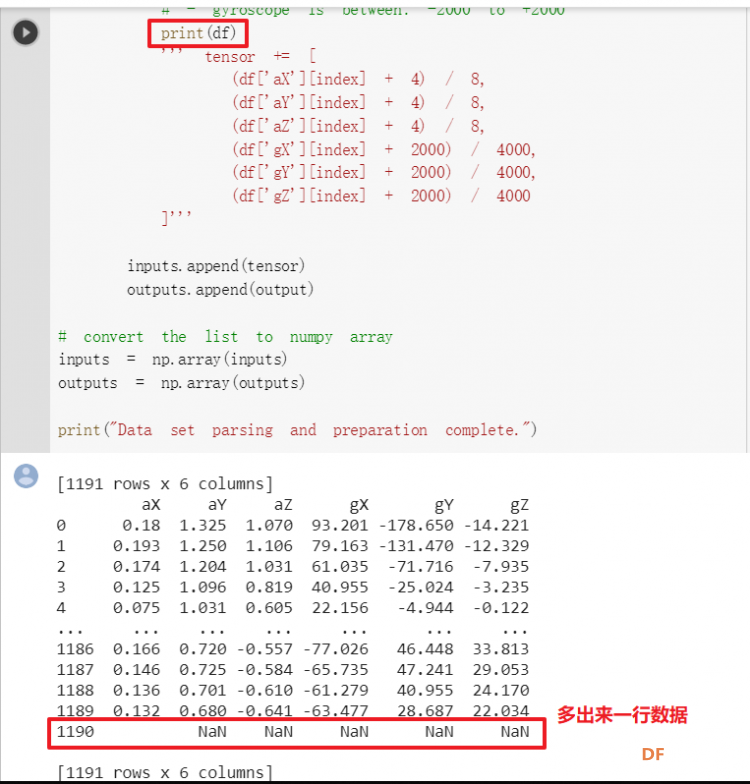 通过输出提示punch正常完成,是flex.csv的数据有问题,打开文件仔细检查,发现第1192行的第一列有一个空格,应该是全选串口监视器的内容时把最后没有数据的一行也选中了,复制到CSV中多出来一行(哭!) 解析顺利完成,没有报语法错误,完成这一步就接下来继续了。当时没有发现问题,后面在其他步骤出现问题的时候再回过头来看发现只对punch.csv进行了解析,没有对flex.csv进行解析。当时调试程序的时候把gesture的长度减了1,所以解析一个文件。这也直接导致后面的步骤频频出现问题。 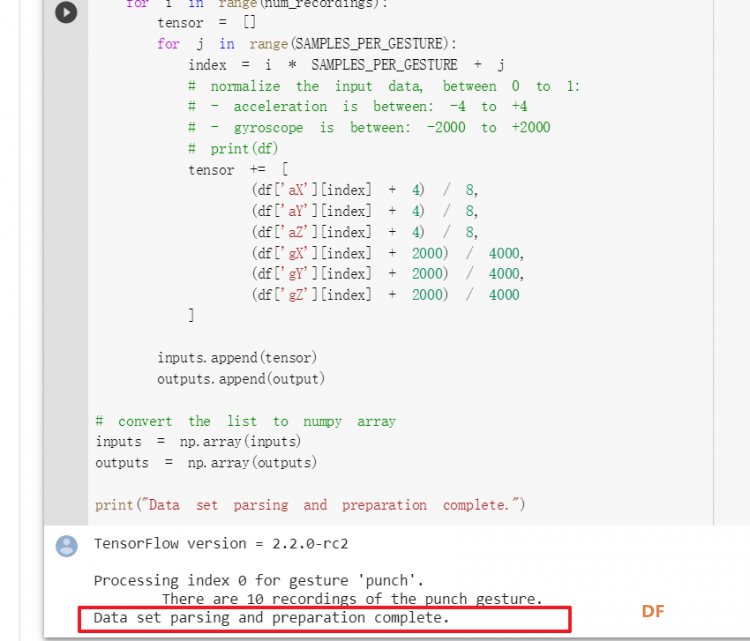 正确完成提示如下: 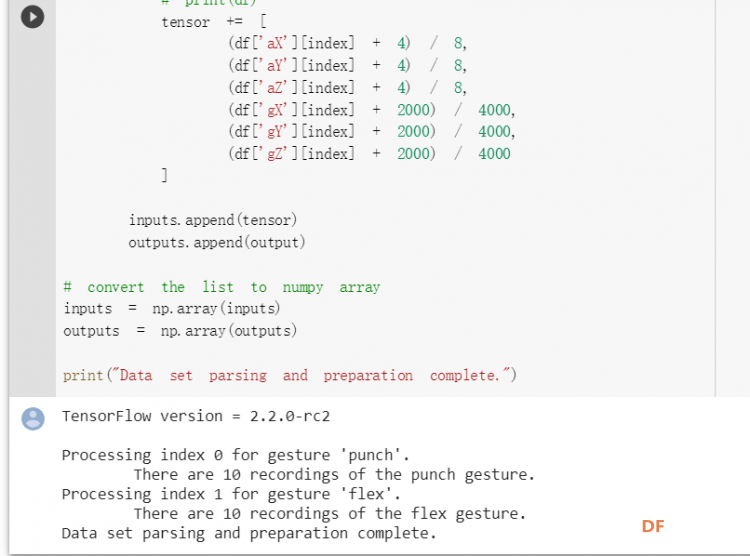 2) 随机分配和拆分输入和输出对以进行训练: [mw_shl_code=python,false]# Randomize the order of the inputs, so they can be evenly distributed for training, testing, and validation # https://stackoverflow.com/a/37710486/2020087 num_inputs = len(inputs) randomize = np.arange(num_inputs) np.random.shuffle(randomize) # Swap the consecutive indexes (0, 1, 2, etc) with the randomized indexes inputs = inputs[randomize] outputs = outputs[randomize] # Split the recordings (group of samples) into three sets: training, testing and validation TRAIN_SPLIT = int(0.6 * num_inputs) TEST_SPLIT = int(0.2 * num_inputs + TRAIN_SPLIT) inputs_train, inputs_test, inputs_validate = np.split(inputs, [TRAIN_SPLIT, TEST_SPLIT]) outputs_train, outputs_test, outputs_validate = np.split(outputs, [TRAIN_SPLIT, TEST_SPLIT]) print("Data set randomization and splitting complete.")[/mw_shl_code] 将输入、输出随机化和分割以进行训练 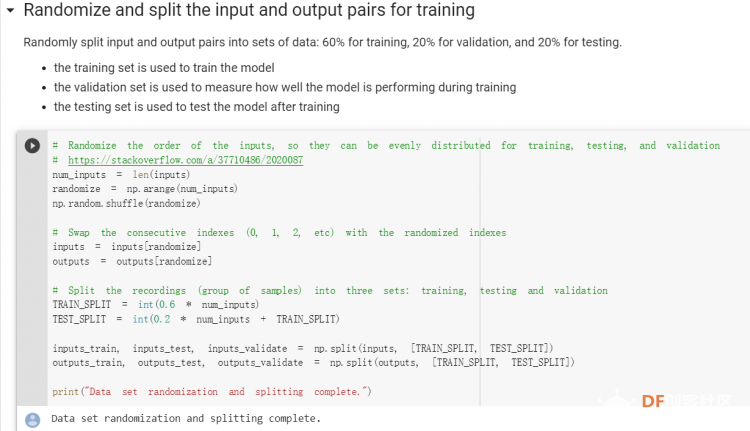 3) 构建和训练模型 [mw_shl_code=python,false]# build the model and train it model = tf.keras.Sequential() model.add(tf.keras.layers.Dense(50, activation='relu')) # relu is used for performance model.add(tf.keras.layers.Dense(15, activation='relu')) model.add(tf.keras.layers.Dense(NUM_GESTURES, activation='softmax')) # softmax is used, because we only expect one gesture to occur per input model.compile(optimizer='rmsprop', loss='mse', metrics=['mae']) history = model.fit(inputs_train, outputs_train, epochs=600, batch_size=1, validation_data=(inputs_validate, outputs_validate)) [/mw_shl_code] 一共600个epoch 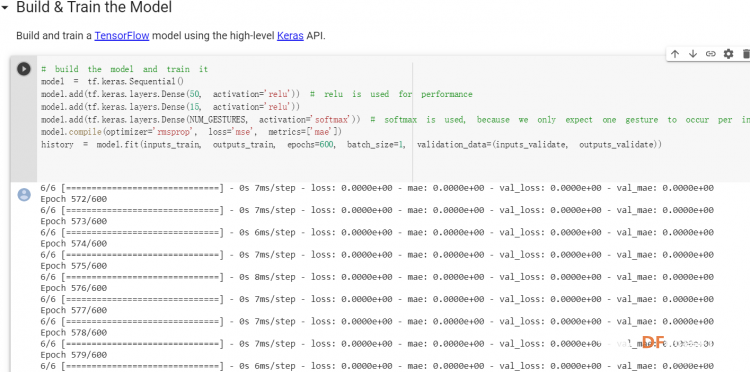 训练时发现loss为0(也是上面同样的原因),重新解析数据后再次训练loss显示正常了。 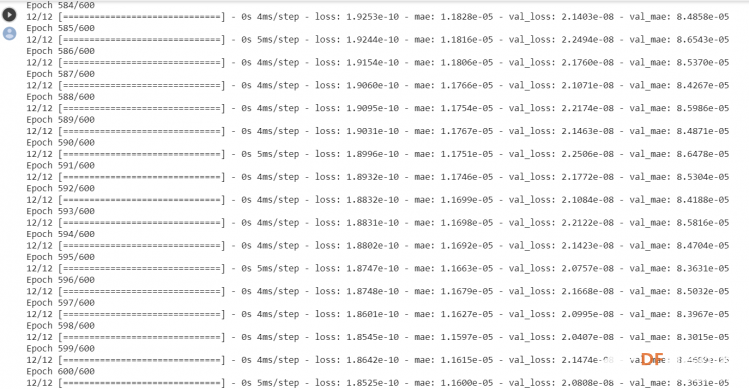 4) 图形化损失 [mw_shl_code=python,false]# increase the size of the graphs. The default size is (6,4). plt.rcParams["figure.figsize"] = (20,10) # graph the loss, the model above is configure to use "mean squared error" as the loss function loss = history.history['loss'] val_loss = history.history['val_loss'] epochs = range(1, len(loss) + 1) plt.plot(epochs, loss, 'g.', label='Training loss') plt.plot(epochs, val_loss, 'b', label='Validation loss') plt.title('Training and validation loss') plt.xlabel('Epochs') plt.ylabel('Loss') plt.legend() plt.show() print(plt.rcParams["figure.figsize"])[/mw_shl_code] 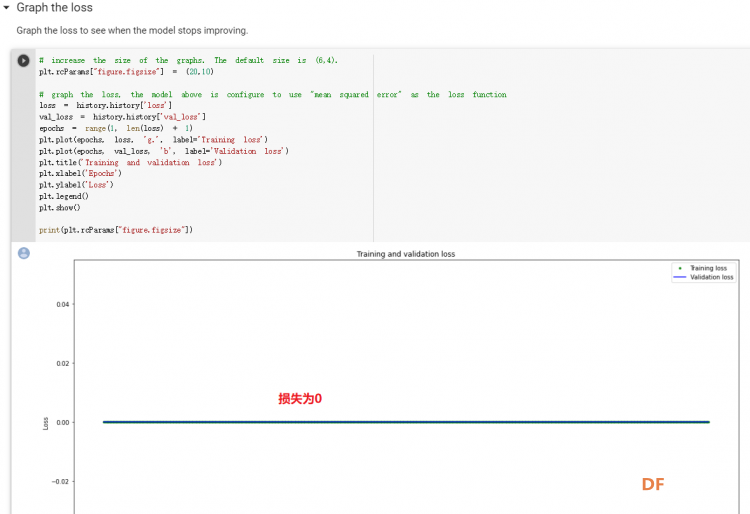 5) 验证 a. 图形化损失 [mw_shl_code=python,false]# increase the size of the graphs. The default size is (6,4). plt.rcParams["figure.figsize"] = (20,10) # graph the loss, the model above is configure to use "mean squared error" as the loss function loss = history.history['loss'] val_loss = history.history['val_loss'] epochs = range(1, len(loss) + 1) plt.plot(epochs, loss, 'g.', label='Training loss') plt.plot(epochs, val_loss, 'b', label='Validation loss') plt.title('Training and validation loss') plt.xlabel('Epochs') plt.ylabel('Loss') plt.legend() plt.show() print(plt.rcParams["figure.figsize"])[/mw_shl_code] 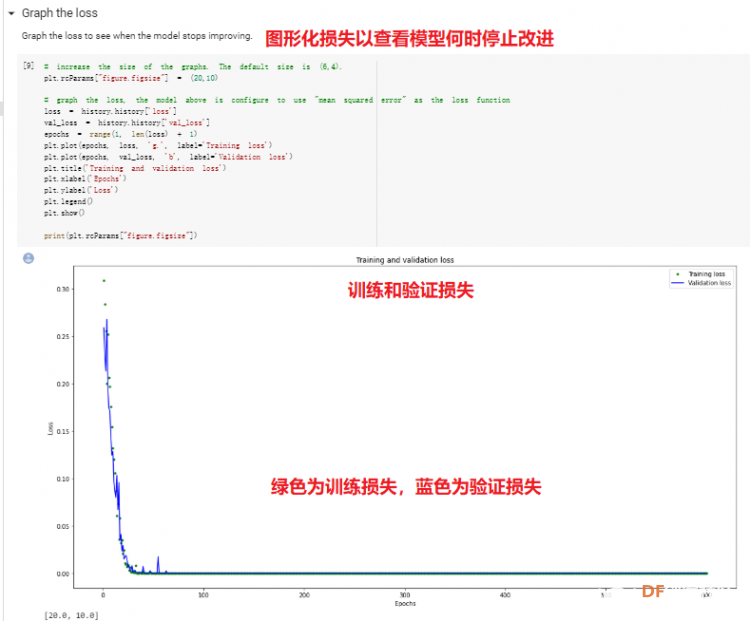 b. 再次图形化损失,跳过开头部分 [mw_shl_code=python,false]# graph the loss again skipping a bit of the start SKIP = 100 plt.plot(epochs[SKIP:], loss[SKIP:], 'g.', label='Training loss') plt.plot(epochs[SKIP:], val_loss[SKIP:], 'b.', label='Validation loss') plt.title('Training and validation loss') plt.xlabel('Epochs') plt.ylabel('Loss') plt.legend() plt.show()[/mw_shl_code] 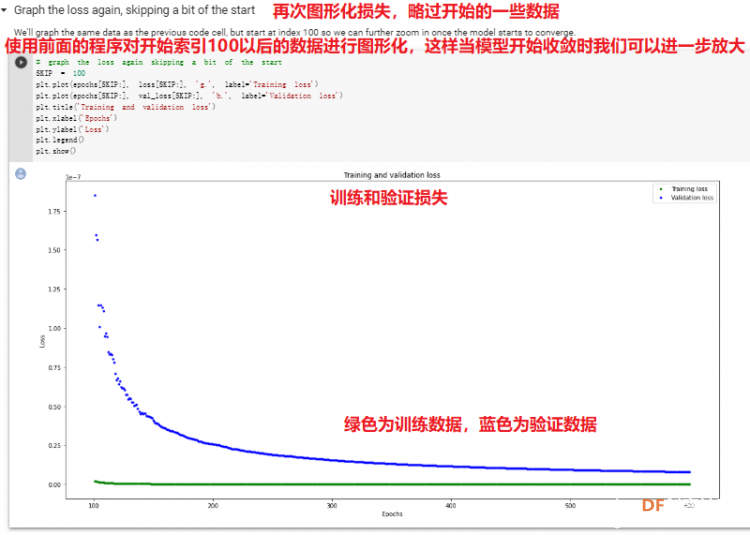 c. 图形化平均绝对误差 [mw_shl_code=python,false]# graph of mean absolute error mae = history.history['mae'] val_mae = history.history['val_mae'] plt.plot(epochs[SKIP:], mae[SKIP:], 'g.', label='Training MAE') plt.plot(epochs[SKIP:], val_mae[SKIP:], 'b.', label='Validation MAE') plt.title('Training and validation mean absolute error') plt.xlabel('Epochs') plt.ylabel('MAE') plt.legend() plt.show()[/mw_shl_code] 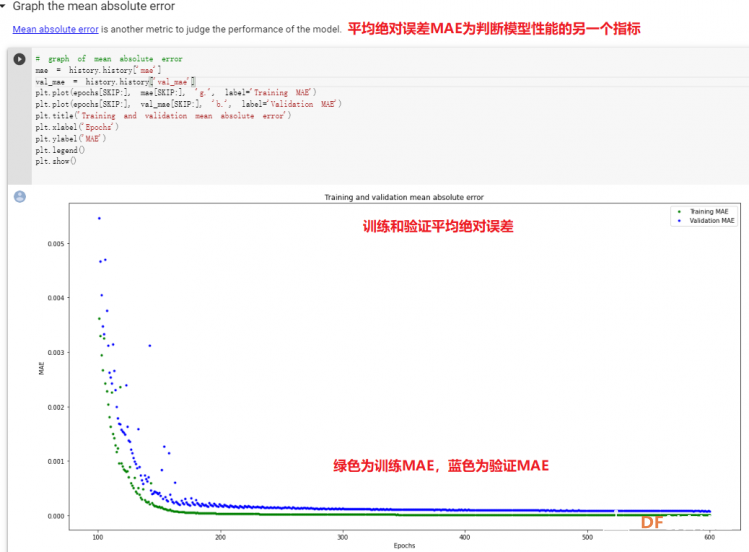 d. 运行测试数据 [mw_shl_code=python,false]# use the model to predict the test inputs predictions = model.predict(inputs_test) # print the predictions and the expected ouputs print("predictions =\n", np.round(predictions, decimals=3)) print("actual =\n", outputs_test) # Plot the predictions along with to the test data plt.clf() plt.title('Training data predicted vs actual values') plt.plot(inputs_test, outputs_test, 'b.', label='Actual') plt.plot(inputs_test, predictions, 'r.', label='Predicted') plt.show()[/mw_shl_code] 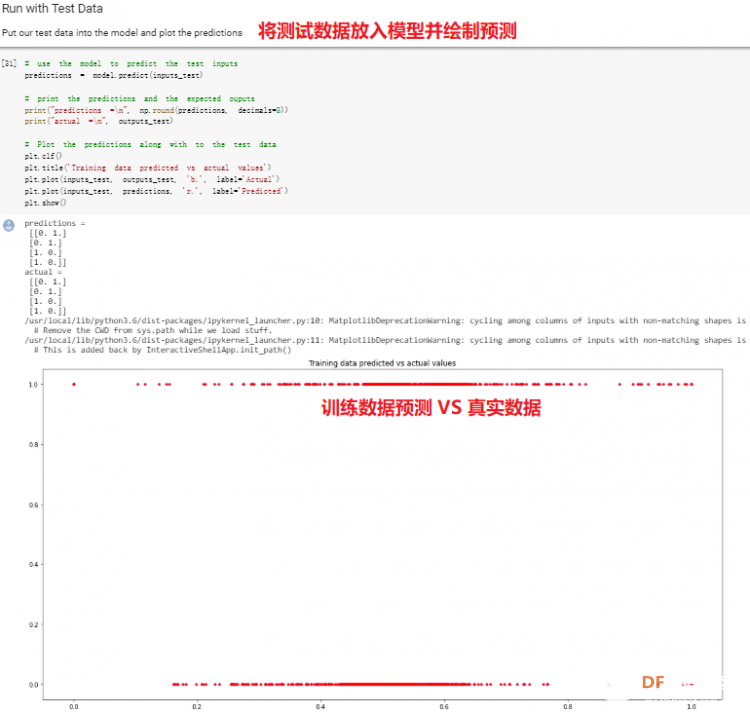 5. 转换训练模型到Tensor Flow Lte [mw_shl_code=python,false]# Convert the model to the TensorFlow Lite format without quantization converter = tf.lite.TFLiteConverter.from_keras_model(model) tflite_model = converter.convert() # Save the model to disk open("gesture_model.tflite", "wb").write(tflite_model) import os basic_model_size = os.path.getsize("gesture_model.tflite") print("Model is %d bytes" % basic_model_size) [/mw_shl_code] 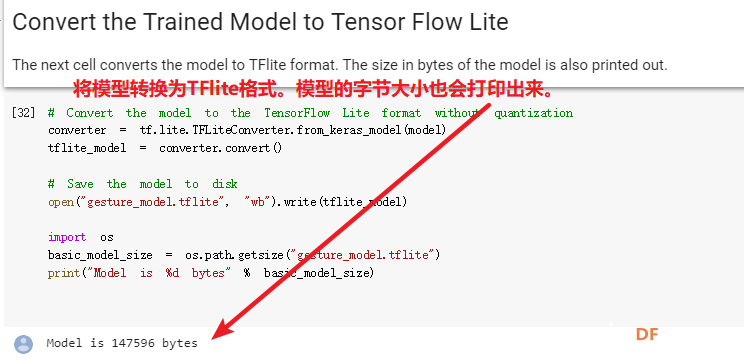 7. 将模型编码到Arduino头文件中 [mw_shl_code=python,false]!echo "const unsigned char model[] = {" > /content/model.h !cat gesture_model.tflite | xxd -i >> /content/model.h !echo "};" >> /content/model.h import os model_h_size = os.path.getsize("model.h") print(f"Header file, model.h, is {model_h_size:,} bytes.") print("\nOpen the side panel (refresh if needed). Double click model.h to download the file.")[/mw_shl_code] 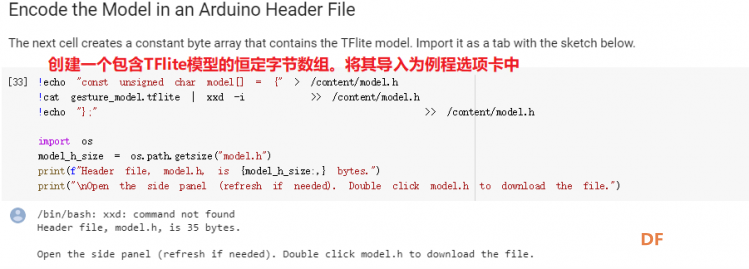 头文件生成后,将文件下载到本地: 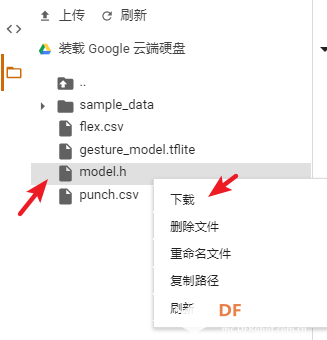 下一节我们回到ARDUINO NANO 33 BLE SENSE使用我们训练好的模型。 |


 沪公网安备31011502402448
© 2013-2026 Comsenz Inc. Powered by Discuz! X3.4 Licensed


 置顶卡
置顶卡 变色卡
变色卡 千斤顶
千斤顶

 版主限定
版主限定
 创作达人
创作达人
 编辑选择奖
编辑选择奖
 ARD DAY
 编辑选择奖
编辑选择奖
 星球译员
星球译员
 编辑选择奖
编辑选择奖
 编辑选择奖
编辑选择奖
 编辑选择奖
编辑选择奖
 编辑选择奖
编辑选择奖
 编辑选择奖
编辑选择奖