树莓派GUI显示温度监控-PySide/PyQT/QML

2021-08-291.1万
精华项目
AI 快速预览详细 收起
本文介绍了如何在树莓派上使用Python和Qt开发温度监控的GUI程序。通过DS18B20模块读取温度数据,并在QML界面中显示温度曲线。项目包括新建工程、编写Python主程序和QML界面文件,以及上传并执行程序的详细步骤。适合零基础新手快速入门,无需复杂前置技能即可完成。
本文介绍在树莓派上使用python和qt开发GUI程序,程序功能为显示DS18B20模块的温度曲线。开发环境依然使用之前介绍的PyCharm编写python代码和远程开发,然后使用QtCreator编写QML界面的方式。
1、新建项目1.1、新建工程
打开PyCharm,新建工程tempMonitor,如下:

树莓派GUI显示温度监控-PySide/PyQT/QML图4

1.2、添加python主程序
tempMonitor.py 主程序如下:
  1. import math
  2. import os
  3. import sys
  4. import time
  5. from pathlib import Path
  6. from PySide2.QtCore import Qt, QObject, Slot
  7. from PySide2.QtQml import QQmlApplicationEngine
  8. from PySide2.QtWidgets import QApplication
  9. class Controler(QObject):
  10.     def __init__(self):
  11.         super().__init__()
  12.         self.tempValue = 0
  13.     @Slot()
  14.     def exit(self):
  15.         sys.exit()
  16.     @Slot(result=float)
  17.     def getTempValue(self):
  18.         file_name = os.path.join("/", "mnt", "1wire", "uncached", "28.99E88D0D0000", "temperature")
  19.         file_object = open(file_name, 'r')
  20.         temp = file_object.read()
  21.         self.tempValue = float(temp)
  22.         print("tempvalue:",self.tempValue)
  23.         file_object.close()
  24.         return self.tempValue
  25. if __name__=='__main__':
  26.     a = QApplication(sys.argv)
  27.     a.setOverrideCursor(Qt.BlankCursor)
  28.     engine = QQmlApplicationEngine()
  29.     controler = Controler()
  30.     context = engine.rootContext()
  31.     context.setContextProperty("_Controler", controler)
  32.     engine.load(os.fspath(Path(__file__).resolve().parent / "ui/monitor.qml"))
  33.     if not engine.rootObjects():
  34.         sys.exit(-1)
  35.     sys.exit(a.exec_())
复制代码
  • 在该程序中,建立一个 Controler 类,并实现了一个获取温度的方法,获取温度后就可以再qml界面中进行显示了。

1.3、添加界面文件
  • 在项目中添加ui文件夹,并新建main.qml文件; 参考代码如下:
  1. import QtQuick 2.11
  2. import QtQuick.Window 2.4
  3. import QtQuick.Controls 2.4
  4. import QtQuick.Controls.Styles 1.4
  5. import QtQuick.Extras 1.4
  6. import QtGraphicalEffects 1.0
  7. import QtCharts 2.2
  8. ApplicationWindow{
  9.     id:root
  10.     width: 800
  11.     height: 480
  12.     visible: true
  13.     visibility: Window.FullScreen
  14.     background: Rectangle{
  15.         color: "black"
  16.         anchors.fill: parent
  17.     }
  18.     Button{
  19.         id:btnexit
  20.         background: Rectangle{
  21.             color: "#a01010"
  22.             anchors.fill: parent
  23.             radius:12
  24.         }
  25.         width: 48
  26.         height: 48
  27.         anchors{
  28.             top: parent.top
  29.             right: parent.right
  30.             topMargin: 8
  31.             rightMargin: 8
  32.         }
  33.         Text {
  34.             text: qsTr("X")
  35.             anchors.centerIn: parent
  36.             font{
  37.                 pointSize: 32
  38.             }
  39.             color: "white"
  40.         }
  41.         onClicked: {
  42.             _Controler.exit();
  43.         }
  44.     }
  45.     Text {
  46.         id: title
  47.         text: qsTr("Temperature Monitor")
  48.         anchors{
  49.             top:  parent.top
  50.             horizontalCenter: parent.horizontalCenter
  51.             topMargin: 20
  52.         }
  53.         font{
  54.             pointSize: 24
  55.         }
  56.         color: "#a0a0a0"
  57.     }
  58.     ChartView{
  59.         id:cv
  60.         width:600
  61.         height:400
  62.         anchors{
  63.             top:title.bottom
  64.             topMargin:10
  65.             left:parent.left
  66.             leftMargin:40
  67.         }
  68.         antialiasing: true
  69.         theme: ChartView.ChartThemeDark
  70.         property int  timcnt: 0
  71.         property double  tempValue: 0
  72.         ValueAxis{
  73.             id:xAxis
  74.             min: 0
  75.             max: cv.timcnt < 10 ? 10 : cv.timcnt + 1
  76.             tickCount: 11
  77.             labelFormat: "%d"
  78.         }
  79.         ValueAxis{
  80.             id:yAxis
  81.             min: 20
  82.             max: 40
  83.             tickCount: 1
  84.             labelFormat: "%d"
  85.         }
  86.         LineSeries {
  87.             name: "Temperature"
  88.             id:lines
  89.             axisX: xAxis
  90.             axisY: yAxis
  91.             width: 3
  92.             color: "#F11C9C"
  93.         }
  94.         Timer{
  95.             id:tm
  96.             interval: 1000
  97.             repeat: true
  98.             running: true
  99.             onTriggered: {
  100.                 cv.timcnt = cv.timcnt + 1
  101.                 cv.tempValue = _Controler.getTempValue()
  102.                 lines.append(cv.timcnt,cv.tempValue)
  103.                 console.log("qml temp value:",cv.tempValue)
  104.             }
  105.         }
  106.     }
  107.     Rectangle {
  108.         width: 80
  109.         height: 300
  110.         color: "transparent"
  111.         anchors{
  112.             left: cv.right
  113.             leftMargin: 20
  114.             verticalCenter: cv.verticalCenter
  115.         }
  116.         Timer {
  117.             running: true
  118.             repeat: true
  119.             interval: 600
  120.             onTriggered: gauge.value = cv.tempValue
  121.         }
  122.         Gauge {
  123.             id: gauge
  124.             anchors.fill: parent
  125.             anchors.margins: 10
  126.             minimumValue: 20
  127.             maximumValue: 40
  128.             Behavior on value {
  129.                 NumberAnimation {
  130.                     duration: 600
  131.                 }
  132.             }
  133.             style: GaugeStyle {
  134.                 valueBar: Rectangle {
  135.                     color: "#e34c22"
  136.                     implicitWidth: 28
  137.                 }
  138.             }
  139.         }
  140.     }
  141. }
复制代码


  • 界面中使用了qml的一个组件 ChartView 用于显示温度的变化曲线;
  • 使用qml的组件 Gauge 来显示变化刻度;

2、执行程序2.1、上传程序到树莓派
在工程上右键将这个项目文件上传到树莓派中:

树莓派GUI显示温度监控-PySide/PyQT/QML图3

2.2、执行程序
上传后,在树莓派对应文件夹中,执行如下命令执行程序:
python3 tempMonitor.py
执行后可以看到显示如下:

树莓派GUI显示温度监控-PySide/PyQT/QML图2

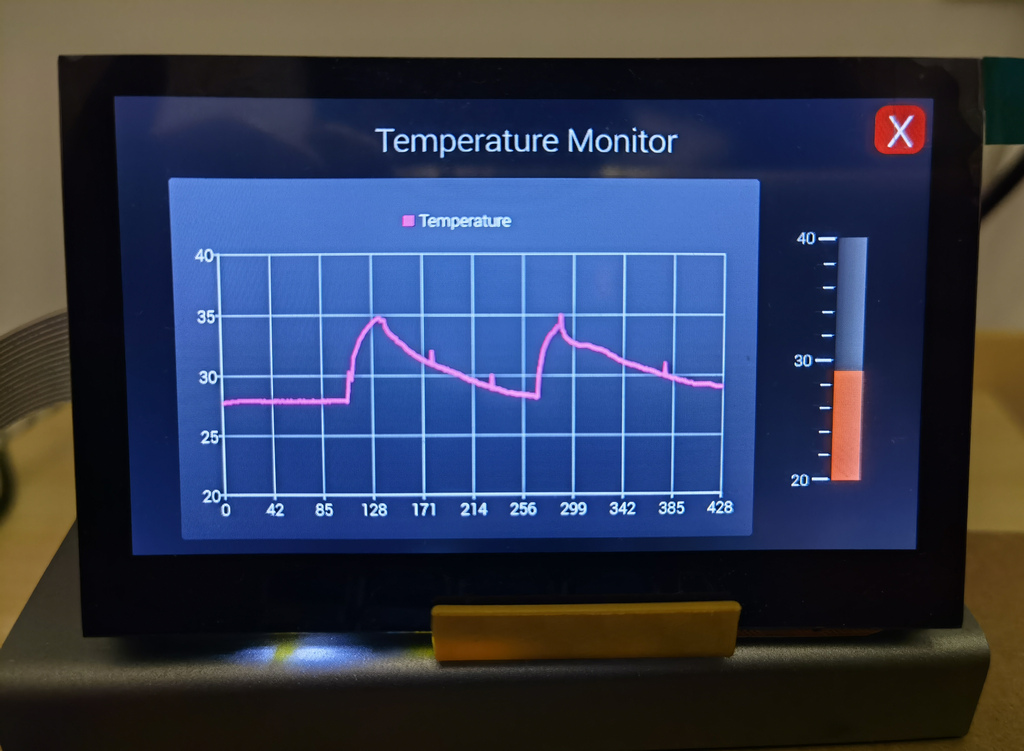
当用手接触DS18B20温度模块后,可以看到温度变化曲线:

树莓派GUI显示温度监控-PySide/PyQT/QML图1

  • 视频演示:


创作许可协议

本项目采用 None(不开放任何权利,保留所有权利) 进行许可。

评论(2)
glwz007
glwz007
感觉自己以后会用到,先收藏了!
许培享
许培享
GUI,先收藏了
- 没有更多了 -